Fundamentals of Ferrite and Noise Mitigation Strategies
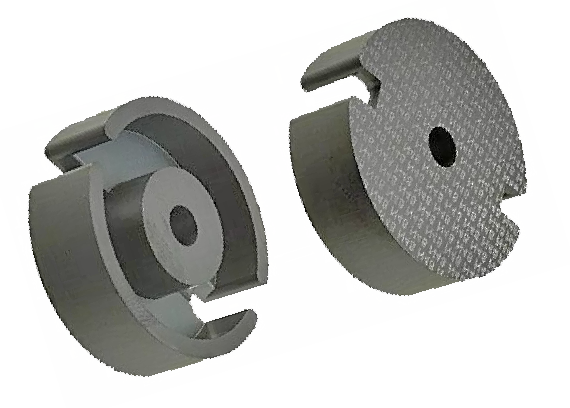
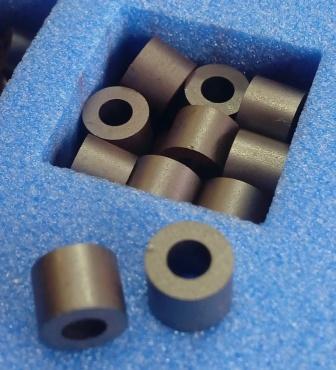
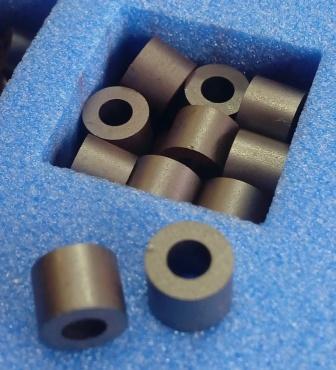
Ferrite, developed by Dr. Kato and Dr. Takei in 1930, is a magnetic oxide material primarily composed of iron (Figure 1). Ferrite is categorized into two types: soft ferrite (used for magnetic core materials) and hard ferrite (used for magnet materials). TDK was founded in 1935 with the goal of producing soft ferrite.
Figure 2 illustrates the B-H curve (also known as the magnetic hysteresis curve) of a magnetic material, which shows how flux density (B) in the material changes when a magnetic field (H) is applied. To understand this concept better, you can think of a magnetic material as an electrical conductor, with the magnetic field acting like an electric field and the flux density similar to electric current. In an electrical conductor, current flows proportionally to the applied voltage, and as the voltage decreases, so does the current, following Ohm's Law. In magnetic materials, however, the flux density increases non-linearly in response to the magnetic field. When the magnetic field is reduced after being increased, the flux density follows a different curve than when the magnetic field was rising, forming what is known as a hysteresis loop.
For hard ferrite, initially, there is little change in flux density as the magnetic field increases, but when the field becomes very strong, there is a sudden rise in flux density, creating permanent magnetization. Once magnetized, applying a reverse magnetic field does not easily return the material to its original state, a property referred to as being "magnetically hard." The stronger this characteristic, the more stable the magnet, as it resists being affected by external magnetic fields, making it an ideal material for permanent magnets.
In contrast, soft ferrite behaves differently. As the magnetic field increases, flux density changes rapidly, causing magnetization. However, applying a reverse magnetic field easily restores the material to its original state, which is why it is considered "magnetically soft." This property makes soft ferrite highly effective for use in transformers or coils, where small changes in the magnetic field can produce significant changes in flux density, enhancing the performance of the magnetic core and making it an excellent material for such applications.

Figure 1: The World's First Ferrite Core

B-H Curve of Soft Ferrite
Let’s take a closer look at the B-H curve of soft ferrite (Figure 3). When ferrite is first produced, no external magnetic field is applied, leaving it in a demagnetized state (point O). As the external magnetic field H increases, the flux density B within the ferrite also increases (magnetizes) along a path known as the initial magnetization curve. When H is increased to a point where B no longer grows (though this is not entirely accurate), the maximum value of B is called the saturation flux density (Bs), representing the highest magnetic flux that can flow through the material.
Now, as H is reduced from the state of Bs, B decreases, but follows a different path than the initial magnetization curve. When H reaches zero, B does not return to the origin, and a residual magnetization (Br) remains within the ferrite. Applying a reverse magnetic field from the Br state causes B to gradually return to zero, at which point H is known as the coercive force (Hc). If H is further applied in the reverse direction, B eventually reaches Bs in the opposite polarity. As H is reduced again, Br reappears, but in the opposite direction. Finally, when H is reapplied in the original direction, B returns to Bs after H passes Hc once more.
In practical applications of soft ferrite as a magnetic core, it's often used in alternating current systems. In these cases, the core can be considered to be at the origin of the B-H curve. When an alternating magnetic field is applied, the alternating B-H loop expands along the initial magnetization curve. Next, we'll examine permeability μ in relation to this initial magnetization curve.

Figure 3: B-H Curve of Soft Magnetic Ferrite.
Initial Magnetization Curve and Permeability
When using ferrite for noise countermeasures, permeability (μ) becomes a crucial characteristic. The relationship between permeability μ, magnetic field H, and saturation flux density B is represented by the following formula (shown in the diagram).
As indicated by formula (1), μ is the slope of the B-H curve. In physics, μ is typically expressed as absolute permeability, but in practical applications, relative permeability is more commonly used. Relative permeability represents how much easier a magnetic material allows magnetic flux to pass compared to a vacuum (or air).
Referring to the initial magnetization curve in Figure 4, the permeability at the very beginning (near the origin O) of the initial magnetization curve is called the initial permeability μi. In most cases, permeability refers to this value. The values listed in ferrite material catalogs usually denote the initial permeability.
As the magnetic field intensity H increases from the initial permeability region, flux density B rises along the initial magnetization curve. When driving a magnetic core fully with an alternating current (uniformly between positive and negative across origin O), permeability is represented by the slope of the line connecting a point on the initial magnetization curve to the origin. This is called amplitude permeability μa. The initial permeability mentioned earlier can be described as the amplitude permeability at very small amplitudes.
Amplitude permeability μa typically increases with increasing H, reaches a local maximum (maximum permeability μm), and then decreases. Therefore, it’s essential to recognize that the permeability of ferrite materials is not a constant μi but varies depending on the magnitude of the excitation.


Figure 4: Initial Magnetization Curve and Permeability Characteristics of Soft Ferrites.
Temperature Dependence of Permeability μ and Curie Temperature
The permeability of ferrite varies with temperature, typically increasing as temperature rises. However, after reaching a local maximum at a specific temperature, the permeability of magnetic materials eventually diminishes, aligning with that of air (μ = 1) as the temperature continues to increase. The temperature at which the magnetic properties of these materials vanish is known as the Curie temperature. For ferrite, the Curie temperature is determined from the temperature at which μi equals 1 on a graph. This graph is constructed by connecting the point where the temperature characteristics of μi decline from a local maximum (μimax) to the points representing 80% and 20% of μimax (see Figure 5).
The variation in permeability with temperature depends on the type of ferrite. To ensure stable characteristics over a broad temperature range, it is advisable to select ferrites that exhibit minimal changes in permeability with temperature. The temperature coefficient αμ and the relative temperature coefficient αF of permeability are commonly referenced as indicators of this temperature dependence in product catalogs.
A reference temperature of Tref = 25°C is recommended. The operating temperature T is determined by the specific temperature zone in which the core will be used, generally selected from the following ranges: –40°C, –25°C, +5°C, +55°C, and +85°C.


Figure 4: Initial Magnetization Curve and Permeability Characteristics of Soft Ferrites.
Temperature Dependence of Permeability μ and Curie Temperature
To explain the relationship between permeability, inductance, and impedance, it is necessary to first understand the concept of the core constant.
When calculating electrical circuit values such as inductance (L), resistance (R), impedance (Z), current (i), and voltage (v) from magnetic material properties like permeability (μ), flux density (B), and magnetic field strength (H), two key factors must be considered: the cross-sectional area A (the area through which the magnetic flux passes) and the magnetic path length l (the distance over which the flux flows). For practical use of magnetic cores, it is important to obtain the effective cross-sectional area Ae and the effective magnetic path length le. This accounts for variations in cross-sectional area across different parts of the core.
Ferrite core catalogs typically provide the values for Ae and le, and these values can be calculated using the following formulas.
Even for cores with complex shapes, it is possible to calculate the effective cross-sectional area Ae and the effective magnetic path length le by breaking the core down into parts. By summing the cross-sectional areas A and the magnetic path lengths l for each part, the total effective values for the entire core can be determined using formulas (4) and (5). For ring-shaped cores, Ae and le can be calculated with specific formulas, and for rectangular (picture frame-shaped) cores, a different set of formulas applies (as shown in the diagram).

where, C1, C2: core constant.


Figure 6: Dimensional Drawing of a Ring Core.

Figure 7: Dimensional Diagram of a Rectangular (Picture Frame-Shaped) Core.

Permeability and Inductance
The relationship between permeability and inductance can be expressed using the following formula

Ae: effective cross-sectional area (m²)
le: effective magnetic path length (m)
μ0: permeability of a vacuum = 4π×10⁻⁷ (H/m)
- N: number of turns in the measurement coil
Lmeasured: measured inductance (H)
The magnetic field intensity H applied to the core (or the flux density B) is determined by the current flowing through the coil or the voltage across it. The relationship between the current i flowing through the coil and the magnetic field intensity H is given by:

- Ne: effective magnetic path length (m)
- N: number of turns in the measurement coil
- i: current flowing through the measurement coil (A)
Note that H is directly proportional to i. When applying an alternating magnetic field to a core, the magnetic field intensity is typically represented as a zero-to-peak value. Consequently, the current should also be expressed as an I₀–P value. For instance, current values displayed on devices like an LCR meter are effective values, so to obtain I₀–P, it must be multiplied by √2 (when the applied alternating magnetic field is sinusoidal).
The relationship between the voltage e across a coil and the flux density B is as follows:

- Ae: effective cross-sectional area (m²)
- N: number of turns in the measurement coil
- e: voltage across the measurement coil (V)
When an alternating magnetic flux flows through the core, the flux density B is typically represented as a zero-to-peak value, similar to magnetic field intensity H. However, since flux density is an integral of voltage, it is necessary to calculate the integral of voltage over time. If the voltage is sinusoidal, the following formula can be used:

- Ae: effective cross-sectional area (m²)
- N: number of turns in the measurement coil
- f: frequency (Hz)
- Vrms: effective voltage across the measurement coil (V)

